

SUSTAINABILITY

AI for sustainability

At Google, we're seeking to make AI helpful for everyone – including the planet – to improve the lives of as many people as possible. Some of the most exciting innovations are happening in places you might never notice – in the clouds formed behind airplanes, the timing of a traffic light at a busy city intersection, the route of your local commute, or the placement of a solar installation.

AI is already helping address emissions in key sectors like transportation and energy. In 2025, nine of our solutions enabled individuals, cities, and partners to collectively reduce an estimated 41 million metric tons of carbon dioxide equivalent (tCO2e).1

For the latest Google Sustainability updates and event information, sign up for our newsletter.


Green Light

Reducing stop-and-go traffic in cities

Green Light uses AI to optimize traffic lights to reduce vehicle emissions in cities, mitigating climate change and improving urban mobility

Road traffic is a major source of greenhouse gas emissions, especially at city intersections where pollution can be 29x higher than on open roads. Intersection emissions from stop-and-go-traffic could be prevented with optimized traffic light timing, but current optimization methods are costly and provide limited information. Green Light uses AI and Google Maps driving trends to model traffic patterns and build intelligent recommendations for city engineers to improve traffic flow.

From the project’s start in 2022 through 2025, Green Light has shared recommendations for roughly 540 signalized intersections globally – about 420 of which were added in 2025 alone – helping optimize traffic flow at intersections crossed by approximately 220 million vehicles every month.2 We estimate that Green Light enabled over 13,000 tCO2e reductions in 20253 – and we expect even greater impact as we continue to expand Green Light to hundreds of cities over the next few years.


Fuel-Efficient routing

Helping people save money and fuel

A person using Google Maps on a smartphone while standing next to a bicycle.

Fuel-efficient routing leverages AI in Google Maps, so people can get to their destinations as quickly as possible while minimizing fuel or battery consumption. We estimate that fuel-efficient routing enabled over 3 million tCO2e reductions in 20254 – equivalent to taking roughly 700,000 gasoline-powered cars off the road for a year.5


Project Contrails

How AI can help mitigate the warming effects of aviation

We’re using AI and satellite imagery to reduce climate-warming contrails

Clouds created by contrails (short for condensation trails) account for roughly 35% of aviation’s global warming impact.6 We’re supporting airlines by providing AI predictions for where these heat-trapping clouds will form, so they can make slight altitude adjustments to navigate around sensitive areas without compromising safety or significantly increasing fuel use. We estimate that the contrail avoidance enabled by this model reduced approximately 3,000 tCO2e in 2025.7


Solar API

Optimizing solar placement for faster and more affordable installation

A "Solar savings estimator" interface showing a heat map of Washington D.C.

Google’s Solar API uses AI to transform high-resolution aerial imagery into precise 3D rooftop models, mapping solar potential for more than 650 million buildings worldwide.8 The tool calculates complex shading variables from nearby structures and trees to determine optimal solar panel placement, helping solar installers, city planners, and energy companies target the highest-potential rooftops and generate permit-ready designs without costly site visits. By streamlining clean energy deployment at scale, we estimate the API helped partners enable over 1.3 million tCO2e in emissions reductions in the United States in 2025 alone,9 while accelerating business growth and job creation in the clean energy sector.


Flood forecasting

Making critical flood forecasting information universally accessible

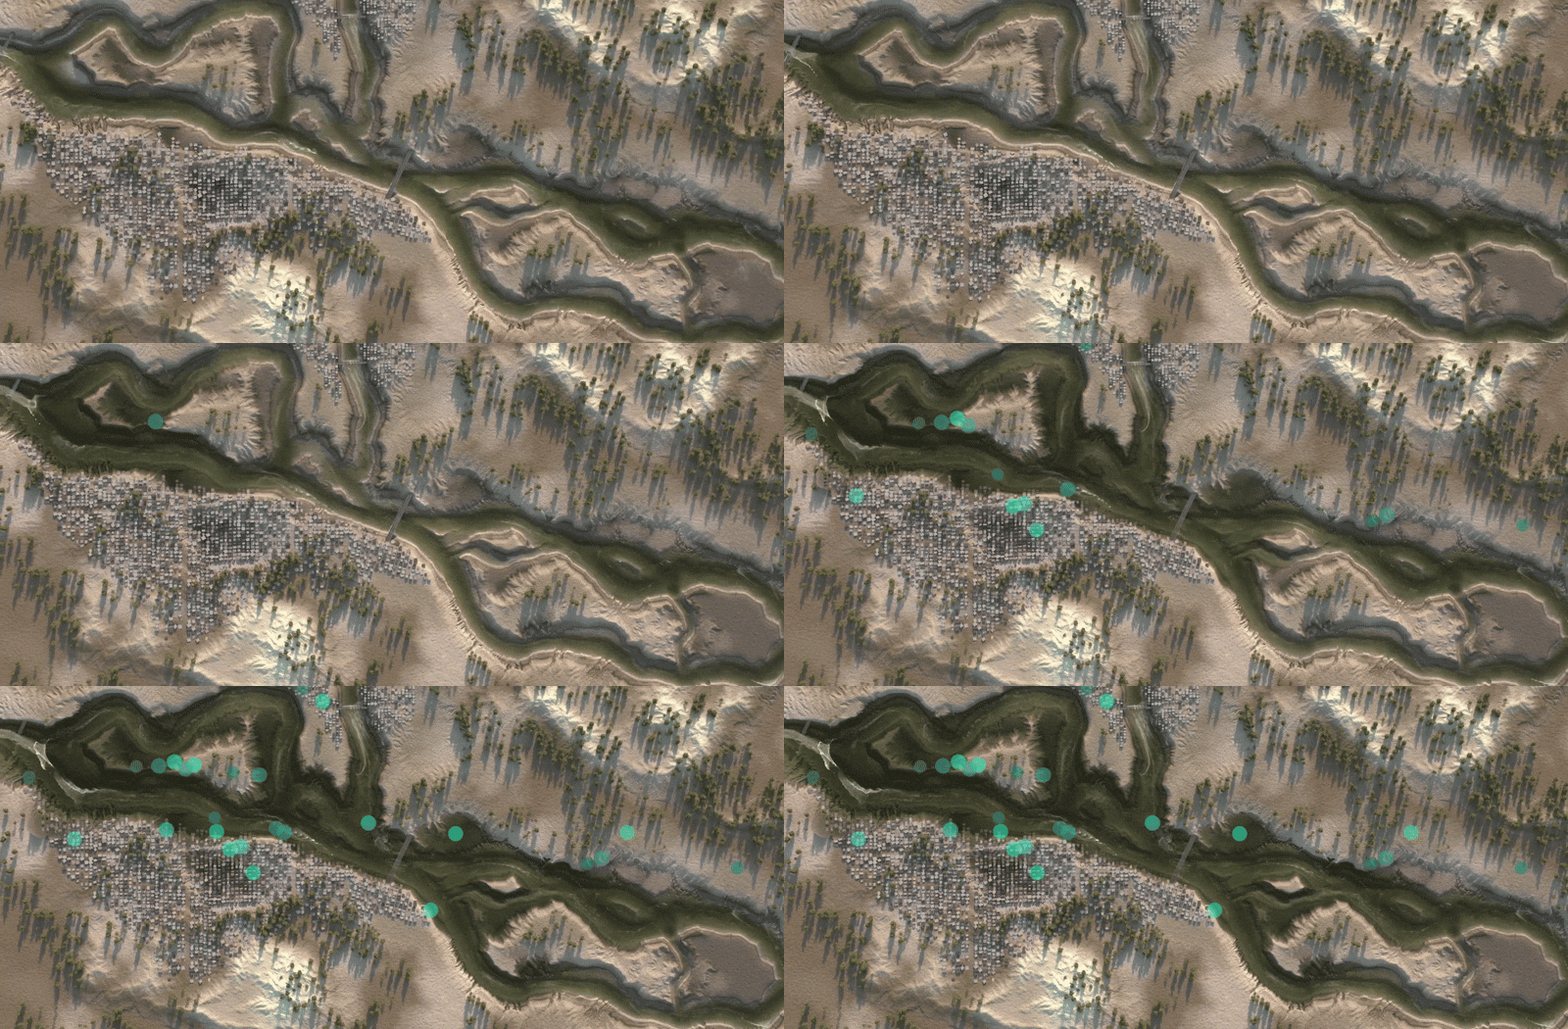
Since 2018 we’ve made progress applying AI to forecast riverine floods. By building a breakthrough global hydrological AI model and combining it with publicly available data sources, we are able to predict floods up to seven days in advance. We are providing forecasts on our Flood Hub platform in more than 150 countries for the most significant and impactful riverine flood events.10 And, in 2026, we added urban flash flood forecasts to predict the risk of flash floods in urban areas up to 24 hours in advance.

Aerial satellite view of a river flowing through a dry landscape and a small town.

FireSat

Providing wildfire information to affected communities

We’re using AI to create breakthroughs in wildfire detection

In partnership with Earth Fire Alliance and Muon Space, we’ve launched four FireSat satellites as part of a constellation dedicated entirely to detecting and tracking wildfires. FireSat will enable rapid intervention before small fires escalate into “megafires” that release massive amounts of carbon. When the full constellation is operational, it will provide global high-resolution imagery updated every 20 minutes, enabling the detection of early-stage wildfires as small as a classroom.


Cyclones

Supporting better tropical cyclone prediction with AI

A digital map of Miami showing temperature, cool roof area, and tree canopy data.

To help communities respond to disasters earlier, our interactive Weather Lab website showcases AI weather models, including the experimental tropical cyclone model. This model can predict a cyclone’s formation, track, intensity, size, and shape – generating 50 possible scenarios, up to 15 days ahead of time.


1 To estimate aggregate enabled emissions reductions, we first estimate annual reductions for nine product solutions individually (Google Earth, Nest thermostats, Solar API, Ignite Energy Access, fuel-efficient routing, Green Light, alternative route suggestions, Contrails, and Waymo) and then combine the totals. For details about the individual calculation methodologies, refer to the respective endnotes of our 2026 Environmental Report for each product solution. We continue to work to refine our methodologies and inputs for these estimates.

2 This is based on estimated daily vehicle crossings at the intersections where Green Light has been implemented from 2021 to 2025, multiplied by the average workdays in a month.

3 To estimate the emissions reductions from the Green Light project, we employ a multi-step methodology. The process begins with calculating the average fuel consumption for a reference vehicle using a validated model. Then, we apply a series of regionalized adjustment factors to reflect real-world fleet characteristics and to reflect the fuel’s well-to-wheels emissions. The foundation of our estimates is a U.S. Department of Energy emissions model, which we use to calculate the fuel consumption of a reference vehicle based on vehicle trajectory data collected for at least three weeks before and after a Green Light recommendation is implemented. To determine the reference vehicle’s fuel efficiency (e.g. average fuel consumption [liters of gasoline equivalent per 100 km]), we analyzed data points from driving sessions covering both city and highway driving, over a period of 10 days. To adapt the baseline model results to diverse, real-world conditions, we apply three distinct adjustment factors: fleet mix factors, CO2 e factors, and well-to-wheels factors. This figure covers estimated enabled emissions reductions for the calendar year, from January through December. Enabled emissions reductions estimates include inherent uncertainty due to factors that include the lack of primary data and precise information about real-world actions and their effects. These factors contribute to a range of possible outcomes, within which we report a central value. The data and claims have not been independently verified.

4 Google uses an AI prediction model to estimate the expected fuel or energy consumption for each route option when users request driving directions. We identify the route that we predict will consume the least amount of fuel or energy. If this route is not already the fastest one and it offers meaningful energy and fuel savings with only a small increase in driving time, we recommend it to the user. To calculate enabled emissions reductions, we tally the fuel usage from the chosen fuel-efficient routes and subtract it from the predicted fuel consumption that would have occurred on the fastest route without fuel-efficient routing and apply adjustments for factors such as: CO2 e factors, fleet mix factors, well-to-wheels factors, and powertrain mismatch factors. This figure covers estimated enabled emissions reductions for the calendar year, from January through December. Enabled emissions reductions estimates include inherent uncertainty due to factors that include the lack of primary data and precise information about real-world actions and their effects. These factors contribute to a range of possible outcomes, within which we report a central value. The data and claims have not been independently verified.

5 “Greenhouse Gas Equivalencies Calculator,” U.S. Environmental Protection Agency, November 2024, last accessed March 2026.

6The Contribution of Global Aviation to Anthropogenic Climate Forcing for 2000 to 2018,” Atmospheric Environment, January 2021. Calculated using Supplementary data to compare the global warming potential (GWP100) of contrails to the total global warming potential of the three primary aviation pollutants (CO2, NOx, and contrails).

7 To estimate enabled emissions reductions in 2025, we modeled contrail formation for avoidance-routes and cost-optimal baselines, and compared their relative warming impacts. We base the contrail warming potential (CO2 e/km) on the best-available scientific evidence. For additional details, refer to the Project Contrails website and the Efficacy of Scalable Airline-led Contrail Avoidance paper. These factors contribute to a range of possible outcomes, within which we report a central value. The data and claims have not been independently verified.

8 The Solar API estimates the rooftop solar potential of buildings around the world, using high resolution, 3D models of individual roofs from our aerial imagery in Google Maps. We’ve counted the number of individual buildings for which we have data, and which can be accessed via a lat-long in Google Maps Platform.

9 To estimate the annual emissions reductions enabled in 2025, Google estimated the number of buildings that installed solar panels shortly after calling the Solar API. For calls from 2023 to 2025, we counted the number of buildings that had a publicly issued solar permit within six months of the API call; for calls between 2020 and 2022, we estimated the number of installations via historical conversion rates. We then used Lawrence Berkeley National Laboratory’s Tracking the Sun dataset to estimate the average installation size per state, NREL PVWatts to provide insolation data, and the NREL Cambium model to estimate the amount of emissions reduced by the energy generated due to those panels. Each installation dating back to 2020 contributes to the enabled emissions reductions in operating year 2025 for this annual estimate. Enabled emissions reductions estimates include inherent uncertainty due to factors that include the lack of primary data and precise information about real-world actions and their effects to date, as well as forward-looking projections. Google is relying on its own substantiation of the enabled emissions reduction impact, in consultation with multiple third-party partners that have reviewed and support the methodology discussed herein. The data and claims have not been independently verified.

10 The estimated population covered for significant events is as of July 2025, based on the forecasted flood risk area, using the WorldPop Global Project Population dataset. Significant flood events are events that meet a predetermined threshold based on an internal rating scheme that takes into account a number of factors.

11 We’ve updated our methodology for estimating our fleet-wide compute efficiency. This is based on internal analysis of the estimated energy consumption required for comparable work with CPU and GPU/TPU hardware from 2020 compared to 2025.

12 These calculations are based on internal data. Google’s TPU power efficiency relative to the earliest generation Cloud TPU v2 is measured by peak FP8 flops delivered per watt of thermal design power per chip package.

13 This calculation is based on internal data, as of April 2026.

14 For details about the calculation, refer to the Methodology section in the Detailed disclosures section of our 2026 Environmental Report.

15 The total GW figure represents clean energy procured through power purchase agreements, energy storage agreements, and agreements under which Google receives environmental attribute certificates. Actual generation may vary from contracted amounts based on project modifications, terminations, and performance.